In:
Funds
- Navigating the intricate world of actively managed funds can often feel like a journey through uncharted territory. This article aims to shed light on this elusive topic, guiding you through the nuances and intricacies of active fund management.
- In a financial landscape that is perpetually evolving, the ability to discern between mere market noise and genuine fund activity has never been more crucial. Actively managed funds promise the allure of superior returns and the potential to outperform the market, but how can one truly recognize the desired level of activity and skill in managing these funds? This article embarks on an explorative journey, delving into the key indicators of actively managed funds being truly active.
1. The Vigor and Prospects of Actively Managed Funds
- Active fund managers are consistently tasked with demonstrating their effectiveness and the value they bring to their clients' portfolios. Clients are always on the lookout for the best returns and strategies that active managers can offer.
- The realm of active fund management continues to be robust. By 2025, global assets under management (AUM) are projected to surge by 31% to US $145.4 trillion. Active investments are anticipated to constitute a significant 60% of this total AUM, underscoring the dynamic nature and efficiency of active market strategies.
- Despite the plethora of funds branding themselves as "active" in the market, a substantial number fall short of embodying true active management. The crux of successful investing lies in adeptly pinpointing those rare funds that are genuinely active and have a consistent track record of delivering alpha.
2. Three Key Indicators of Active Fund Management
- Low Turnover A turnover ratio in the 20%-30% range suggests a buy-and-hold strategy, indicating a good management style in most of the traditional funds. High turnover may imply excessive trading, which can erode returns and cause high costs.
- Turnover refers to the frequency with which assets within a portfolio are bought and sold over a specific period, typically a year. In the context of an investment fund, the turnover ratio measures the proportion of the portfolio's holdings that have been replaced in that period.
- High Conviction: Successful active managers invest in securities they strongly believe in. If a fund has more than 20 highly concentrated positions, it may raise questions about the depth of the manager's convictions.
- High Tracking Error: A high tracking error indicates that the manager is actively seeking alpha, or excess returns. A low tracking error might suggest the fund is merely tracking an index.
3. Pomiar Zarządzania Aktywnego: Koncept Active Share
- Developed by Martijn Cremers and Antti Petajisto in 2006, active share measures how much an equity portfolio's holdings differ from its benchmark. It quantifies the difference between the portfolio and its benchmark in terms of individual stock holdings.
- To calculate active share, one must first determine the absolute differences between the weights of each security in the portfolio and the corresponding weights of those securities in the benchmark index. Once these absolute differences are obtained for all securities, they are summed up. The resulting sum is then divided by two to get the active share percentage.
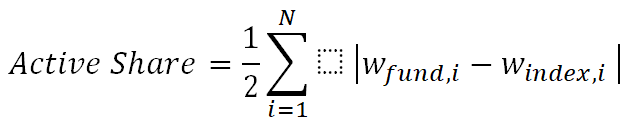
- A portfolio with an active share of 100% would indicate no overlap with the benchmark, meaning it's entirely actively managed, while an active share of 0% would suggest the portfolio mirrors the benchmark exactly. The higher the active share, the more distinct the fund's holdings are from its benchmark.
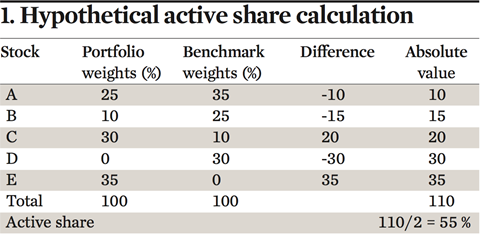
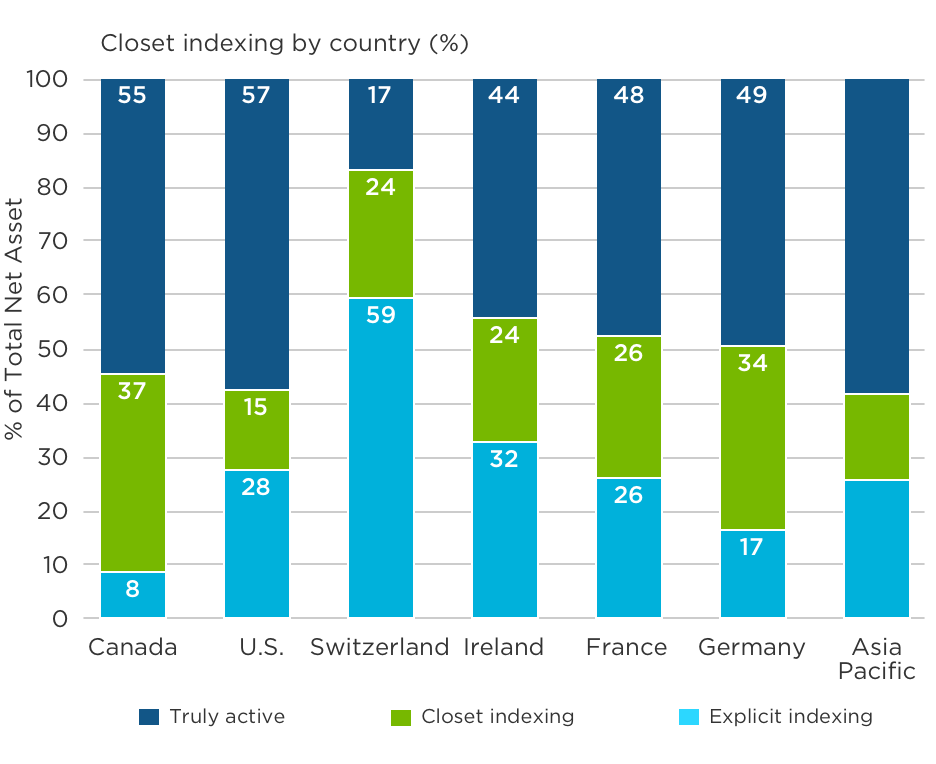
- Active share can reveal "closet indexers" – funds that closely resemble their benchmarks while charging active management fees. An active share below 60% might indicate a closet indexer.
4. Alternative measures: R-squared and Tracking Error
R-squared: Correlation and Calculation
- Overview: R-squared measures the percentage of a fund’s movements that are explained by its benchmark, ranging from 0 to 100.
- Calculation:It is calculated using a regression analysis, where the fund’s returns are regressed against the benchmark’s returns. The R-squared value is the square of the correlation coefficient between the fund and the benchmark.
- Implications: A high R-squared indicates a strong correlation with the benchmark, while a low R-squared suggests greater independence in the fund’s movements.
Tracking Error: Volatility and Consistency
- Overview:Tracking error measures the standard deviation of the fund’s excess returns relative to its benchmark.
- Calculation:It is calculated by taking the standard deviation of the difference between the fund’s returns and the benchmark’s returns over a specific period.
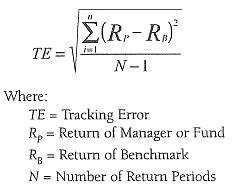
- Implications:A high tracking error indicates more volatility and potential for active management, while a low tracking error suggests consistency and potential alignment with the benchmark.
5. Conclusion
- In conclusion, discerning the true activity level of actively managed funds requires a multifaceted approach, incorporating a variety of metrics and analytical perspectives. Active share stands out as a pivotal tool, providing clear insight into how much a fund’s holdings diverge from its benchmark, and helping investors identify genuine active management as opposed to closet indexing. On the other hand, R-squared and tracking error, while offering valuable information about a fund’s correlation to its benchmark and the consistency of its performance, have their limitations and should not be relied upon in isolation.


